An innovative, market-proven product against drought and excess moisture.
Advanced weather risk management tool that mitigates financial impacts from drought and excess moisture events.
Tracks the balance between precipitation (P)(rainfall) and potential evapotranspiration (PET) (moisture from soil and plants) over a defined period / season.
We identify the historical norm for the area and measure how much drier or wetter conditions are relative to the average.
We calibrate the index structure and trigger thresholds against client loss and cost experience, and known historical events, to best meet the risk transfer needs of the client.
The Formula: (P – PET = WBI)
Water Balance Index ©
The average of the daily water balance over a risk period:
Positive WBI (>0):
More precipitation than evapotranspiration = Wet Conditions, water surplus (flood potential, soil moisture increase
Zero WBI (~0):
Balanced conditions (water input and output close to equal)
Negative WBI (<0):
More evapotranspiration than precipitation = Dry Conditions, water deficit (drought risk, soil moisture depletion)
Water Balance value can be read in the Y-axis as either
0 (normal conditions)
+1, +2, +3 (wet conditions)
-1, -2, -3 (dry conditions)
You can visualise your index over time, allowing clients to quickly assess its efficiency and interpret the frequency and severity of historical events.
🟥 Drought
🟦 Excess moisture
Data Provider: ECMWF (ERA5 / ERA5-Land)
CelsiusPro uses objective, verifiable and independent third-party data to support its parametric financial products. For the water balance index that is the ECMWF’s state of the art ERA5 and ERA5-Land gridded datasets, having a reliable record beginning in 1979 to the present.
ERA5 provides hourly estimates of a large number of atmospheric, land and oceanic climate variables. The data covers the Earth on a 31km grid and resolves the atmosphere using 137 levels from the surface up to a height of 80km.

Cover Applications
The WBI can be used to detect drought and excess moisture conditions over various time scales and risk periods:
𝗈 Seasonal Droughts
𝗈 Excess or deficit moisture during emergence
𝗈 Preseason moisture
𝗈 Excess Moisture at seeding
𝗈 Wet Harvest
𝗈 Moisture Deficits during booting/ heading/flowering
Additional applications and users include:
𝗈 Financial institutions with agricultural lending exposure
𝗈 Agricultural supply chain and business disruptions
𝗈 NGOs focused on income and food security for vulnerable populations
𝗈 Industrial / Municipal water supply risk
𝗈 Government fiscal risk against wide-scale drought catastrophes
The Exposure

Gridded datasets like ERA5 divide the Earth into equal grid cells, each containing modelled weather variables representing conditions within that cell area.
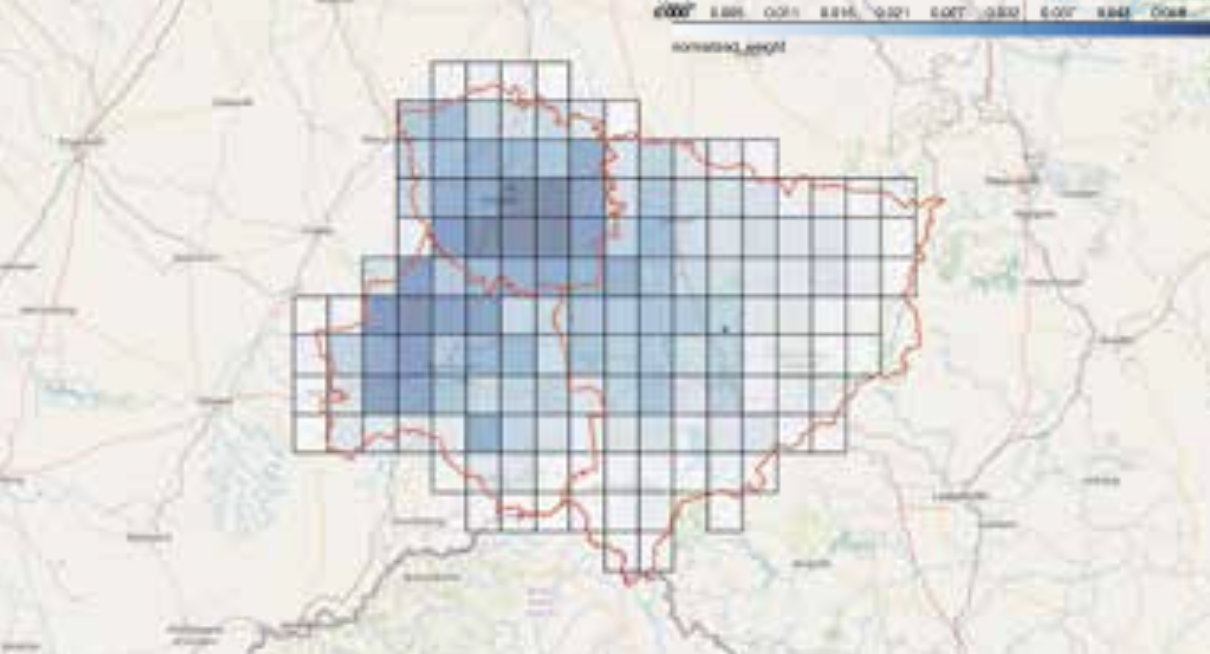
Our additional weighting feature allows assignment of different weights to grid cells rather than treating them equally, using sources like GFSAD or global population maps, to represent areas of higher agricultural or population impact
Payout structure visualized for Deficit Water Balance

If the average of the daily water balance over the full risk period is lower than the trigger value, the policy holder will receive a fixed amount for each mm of water balance shortfall up to the cover limit.
EXAMPLE
Cover period: May 1st – 11th
Trigger: < 5mm
Payout per mm: USD 10,000
Cover limit: USD 100,000
Over the risk period,, the independent data provider reports daily rainfall and daily potential evapotranspiration that lead to 1.9mm of average water balance:
PAYOUT PROFILE
Payout calculation:
5mm trigger water balance – 1.9mm average water balance = 3.1mm) 3.1 * USD 10,000 payout per mm water balance = USD 31,000