An innovative, market-proven product against drought and excess rainfall.
Advanced weather risk management tool that helps safeguard your income against both drought and excess moisture
Tracks the balance between precipitation (rainfall) and evapotranspiration (moisture from soil and plants) over a defined period / season
THE FORMULA
↓ PRECIPITATION
↑ EVAPOTRANSPIRATION
↓↑ WATER BALANCE INDEX

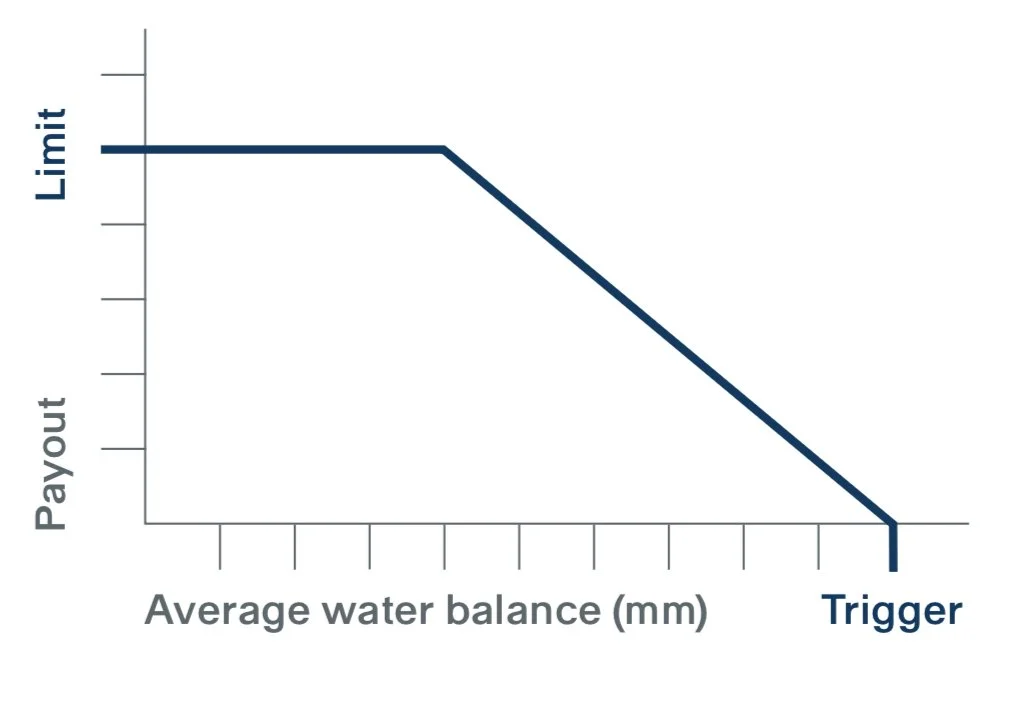
Low Water Balance Season Cover Payout for Deficit Water Balance

If the average daily water balance is lower than the trigger amount of water balance, the policy holder will receive a fixed amount for each mm of water balance shortfall up to the cover limit.
EXAMPLE
KEY SELLING POINTS
° No proof of physical loss to your property
° No proof of loss to Business Income
° Wire transfer of loss payment within days directly to the Insured
° Loss trigger based on data from the National Hurricane Center (NHC)
° Transparent product administrated through best-in-class platform solution
° Backed by reputable reinsurer
Cover period: May 1st – 11th
Trigger: < 5mm
Payout per mm: USD 10,000
Cover limit: USD 100,000
HRRI EVENT COVERAGE TABLE
If the path of a Hurricane intersects the Insured Location, loss payments are due based on the Event Coverage Table.

HOW IS IT MEASURED
The National Hurricane Center (NHC) provides 6 hourly and landfall measurement points for each Hurricane track. The measurement point information includes: windspeed, storm category, geolocation, and time.
The relevant hurricane category for the insurance is the highest value of:
a) The last measurement point before the track
intersects the Insured Location
b) Any measurement point within the Insured
Location
c) The first measurement point after the track has
left the Insured Location

PAYOUT EXAMPLES
HRRI POLICY TERMS EXAMPLE

Scenario 1
A shop owner in Panama City FL purchased a HRRI for the storm season 2019 with a Policy Limit of $1,000,000. The Insured Location is a circle with 40 miles radius with the shop location as the Insured Address‘.

Hurricane Michael intersected the Insured Location as a Category 5 Storm. The owner received $1,000,000 payout.
Scenario 2
A boat rental company in Port Aransas TX purchased a HRRI for the storm season 2017 with a Policy Limit of $500,000. The Insured Location is a circle with a 40 miles radius around the harbor.

Hurricane Harvey intersected the Insured Location as a Category 4 storm. The boat rental company received a $200,000 payout.
Scenario 3
A hotel in New Oreleans purchased a HRRI for the storm season 2005 with a Policy Limit of $500,000. The Insured Location is a circle with a 40 miles radius around the hotel.

HuKatrina intersected the Insured Location as a Cat 3 storm. The Hotel received a $100,000 payout.
We find the historical norm in the area and measure how much dryer or wetter the conditions could be against the average
By cross-referencing historical losses with the WBI, we can find the level at which yield loss occursand set the trigger thresholds accordingly